
LCA of U.S. Cotton Fiber Production
Discover the most current, comprehensive, independently reviewed data on U.S. cotton fiber, a credible foundation for sourcing, reporting, and compliance.
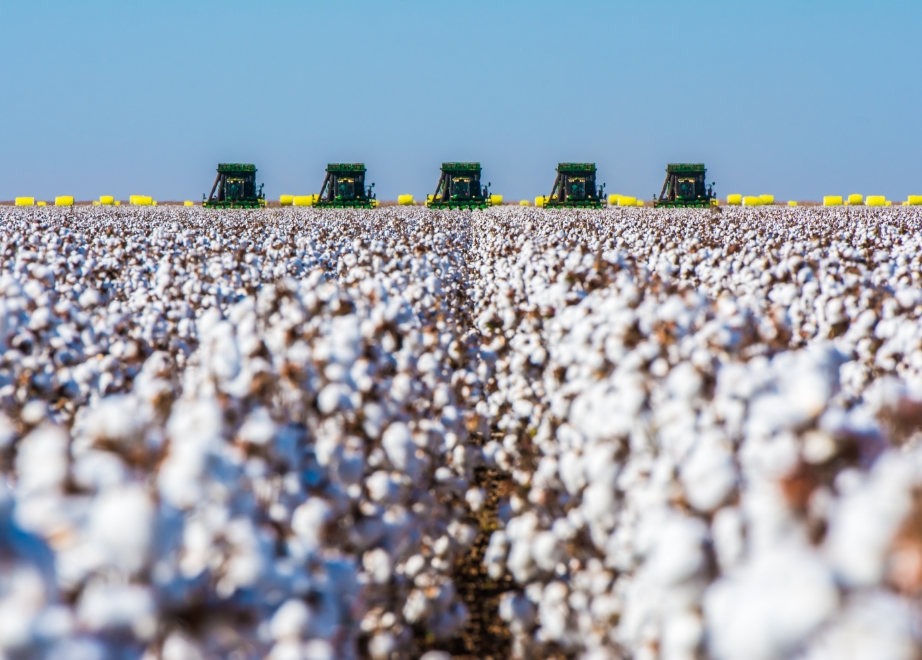
Understanding the Impact of U.S. Cotton Production
The 2026 Life Cycle Assessment (LCA) of U.S. Cotton Fiber Production provides current, independently reviewed data on the cradle-to-gate environmental profile of U.S. cotton fiber. Built on primary data from 753 growers across 17 states, the study delivers an updated U.S. average life cycle inventory and impact results that brands, retailers, and sustainability professionals can use as an input for Scope 3 Category 1 reporting, sourcing decisions, and compliance readiness.
A Representative Picture of Today’s U.S. Cotton Production
This is the most comprehensive LCA of U.S. cotton fiber production to date. Built on primary farm-level data from 753 U.S. cotton growers across 17 states and four major producing regions, it was conducted in conformance with ISO 14040 and ISO 14044, with critical review per ISO/TS 14071 by a three-expert independent review panel. Together, this scope, methodology, and review process provide a credible, representative reference for understanding the environmental profile of U.S. cotton production.
U.S. Cotton Production from Seed to Baled Cotton
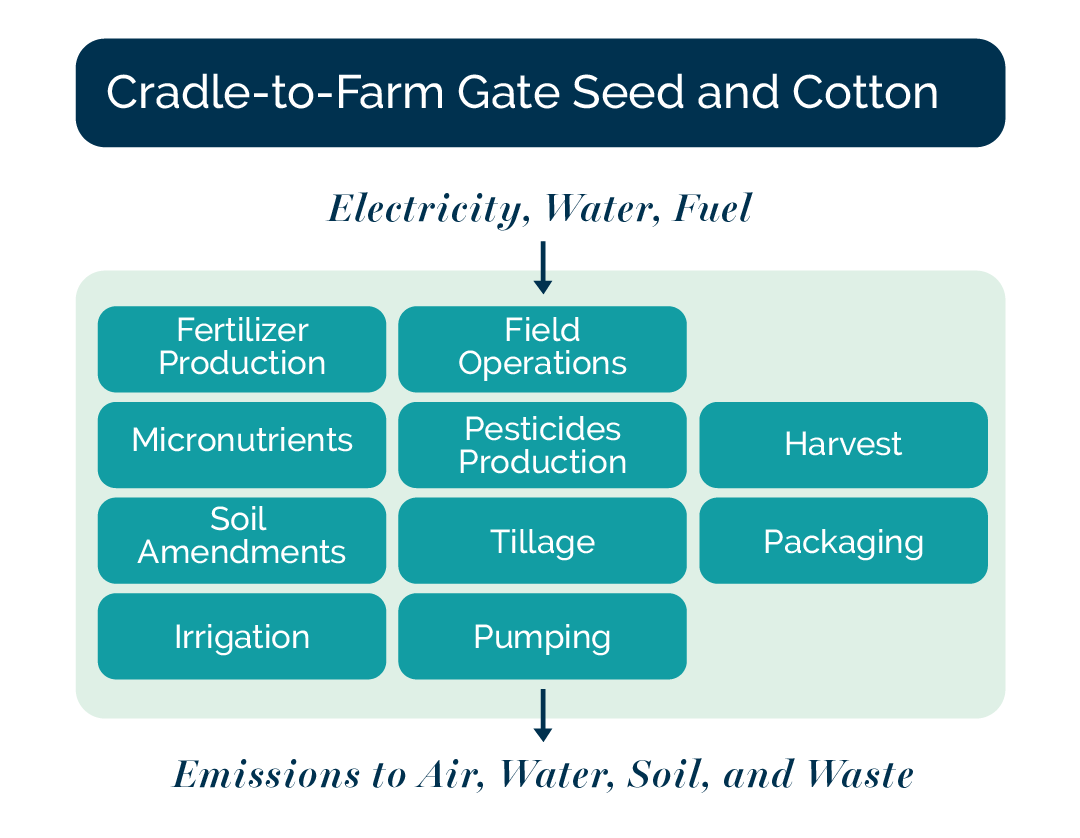
A life cycle assessment, or LCA, is a science-based method for evaluating the potential environmental impacts of a product across defined stages of its life cycle. This LCA focuses on cradle-to-gate U.S. cotton fiber production, including upstream raw material and energy inputs, on-farm production, field-to-gin transportation, and ginning operations.
Producing 1 kilogram of U.S. cotton fiber generates approximately 1.45 kilograms of fossil CO₂e emissions from cradle to gate, while biogenic carbon storage in cotton fiber and soil temporarily removes approximately 1.71 kilograms. The net cradle-to-gate result is –0.264 kilograms CO₂e per kilogram of U.S. cotton fiber.
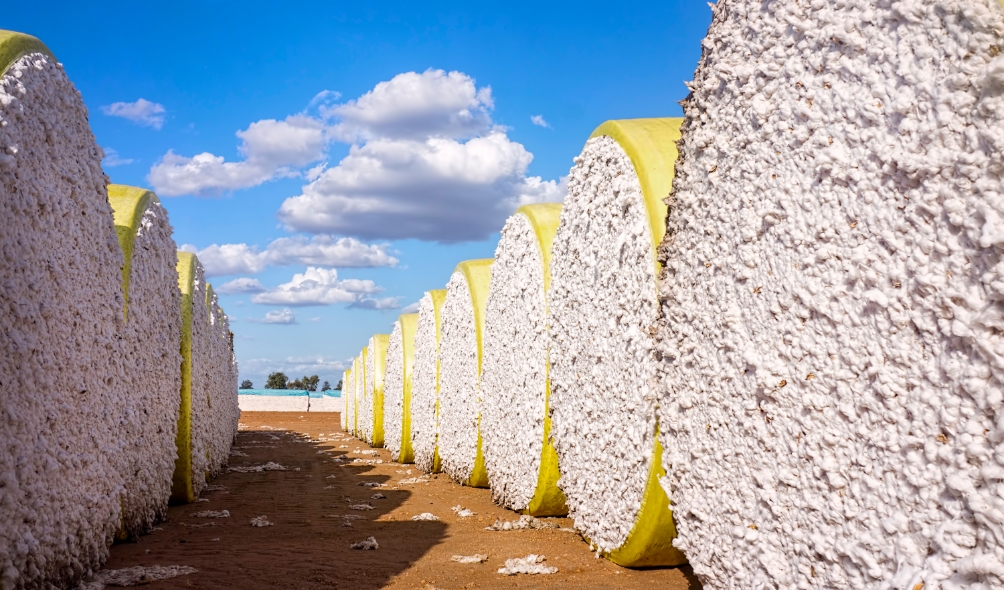

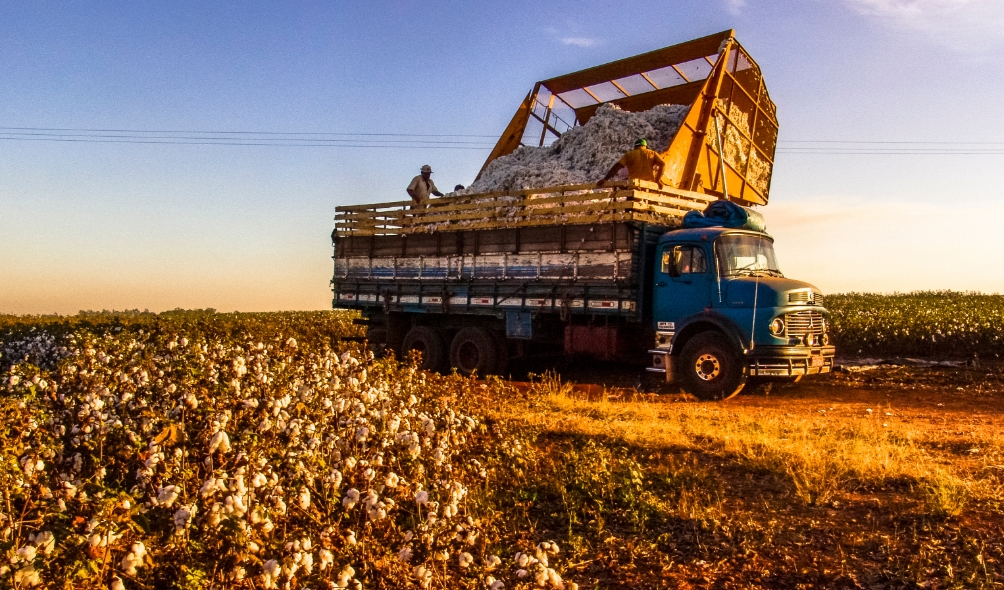
Producing 1 kilogram of U.S. cotton fiber generates approximately 1.45 kilograms of fossil CO₂ equivalent emissions.

Producing 1 kilogram of U.S. cotton fiber temporarily removes approximately 1.71 kilograms of CO₂ equivalent emissions when accounting for biogenic carbon stored in cotton fiber and soil.
Cotton and the Natural Carbon Cycle
Cotton is a plant-based fiber, part of the natural biogenic carbon cycle. As cotton grows, the plant draws CO₂ from the atmosphere and stores carbon temporarily in the cotton fiber and soil.
This temporary storage is different from fossil carbon emissions and should be interpreted in context. The carbon stored in cotton fiber is not permanent and may return to the environment at the product’s end of life through natural processes. Though temporary, this carbon storage distinguishes cotton from petroleum-derived fibers.
Commitment to Continuous Improvement

U.S. cotton growers have spent decades improving their environmental performance, and this study puts real numbers behind that progress. With 753 growers contributing primary data across 17 states, this is one of the most transparent assessments of any fiber available today. As brands face growing pressure to back their sustainability claims with credible science, this LCA gives them exactly that: a clear, independently reviewed baseline for U.S. cotton that can inform sourcing decisions, support regulatory compliance, and identify opportunities for meaningful improvement.
The LCA & Your Brand
As expectations rise for brands to substantiate sustainability claims with reliable data, this LCA provides a clear, independently reviewed reference for U.S. cotton. Built on primary data from real U.S. farms, it supports more informed material selection and Scope 3 Category 1 reporting, helping companies align sourcing decisions with decarbonization strategies, regulatory requirements, and sustainability reporting.
Built into the Tools Brands Already Use
For Cotton Incorporated and the entire cotton industry, the LCA’s findings will inform research priorities, support stakeholders across the cotton value chain, and provide a baseline for understanding current impacts, identifying environmental hotspots, and informing future improvements.
The updated U.S. cotton LCA data has been submitted for inclusion in leading sustainability databases, tools, and platforms, including Higg, ecoinvent, Sphera Managed LCA Content, Glimpact, and Carbonfact. This helps ensure brands, retailers, and sustainability professionals have access to current, representative data when evaluating U.S. cotton.
A life cycle inventory is the catalog of energy, material, and emissions flows associated with a product across its life cycle. The LCI is the data foundation that feeds the impact assessment phase of a life cycle assessment (LCA).
Cradle-to-gate is a life cycle assessment scope that covers raw material acquisition through manufacturing, ending at the factory gate. For this LCA, the scope includes agricultural inputs (e.g., fertilizer, pesticides, fuel, seed) and on-farm cotton production through field-to-gin transportation and ginning, ending at the gin gate. It excludes downstream textile stages (spinning, knitting, weaving, dyeing, finishing, and cut and sew), consumer use, and end-of-life.
Biogenic carbon is carbon that is part of the natural plant-based carbon cycle. As cotton grows, the plant draws CO₂ from the atmosphere and stores carbon temporarily in the cotton fiber and soil.
Because this carbon is different from fossil carbon, LCA standards report biogenic carbon emissions and removals separately. In this study, U.S. cotton production generates approximately 1.45 kg fossil CO₂e per kilogram of cotton fiber from cradle to gate.
When temporary biogenic carbon storage in the cotton fiber and soil is included, the net cradle-to-gate result is –0.264 kg CO₂e per kilogram of cotton fiber. This result should be interpreted in context because the carbon stored in cotton fiber is temporary and may return to the environment at end of life.
When a system produces multiple outputs (cotton fiber, cottonseed, gin byproducts), environmental impacts are allocated between them. This study uses economic allocation as the baseline (83% to fiber, 17% to seed) following the Cascale Higg Product Tools Cotton LCA Methodology. Sensitivity analysis shows that under biophysical allocation, which assigns impacts based on physical and energetic properties of the co-products, impacts attributed to fiber are 58% lower. Both approaches are accepted under ISO 14044.
ISO 14044 requires LCA studies that support comparative assertions or are intended for public disclosure to undergo independent critical review. This study was reviewed by a 3-person panel of external experts, in accordance with ISO/TS 14071, the technical specification governing critical review processes. The full Critical Review Statement is included in Appendix D of the report.
Not directly. LCA results should not be compared unless the studies are designed for comparison and use equivalent methods, boundaries, data sources, assumptions, functional units, allocation procedures, and impact assessment methods.
This is especially important for cotton. The Cascale Cotton LCA Methodology states that comparisons between geographies, cotton data providers, and LCIA results outside the Higg Product Tools are not supported because equal comparison cannot be guaranteed. Differences in geography, crop year, data representativeness, data collection methods, background datasets, and modeling choices can all affect results.
A cotton LCA model-comparison study further showed that even when multiple models used the same harmonized cotton production input dataset, results still varied across models. Climate change results varied by as much as –14% to +30% from the model average, while other impact categories showed larger variation, including eutrophication at –93% to +225%, water resources depletion at –53% to +36%, and freshwater ecotoxicity at –35% to +61%.
For these reasons, this LCA should not be used to make broad comparative claims against other fibers, cotton regions, cotton programs, or unrelated LCA studies. Its strongest uses are to understand the cradle-to-gate impact profile of U.S. cotton fiber production, identify hotspots, support Scope 3 Category 1 reporting where appropriate, and provide current, representative U.S. cotton data for sustainability tools and decision-making.
These terms are related, but they do not measure the same thing. In this LCA, blue water use, blue water consumption, and AWARE water scarcity impacts are calculated. A full water footprint is not calculated.
Blue Water Use, or BWU, measures the total amount of freshwater withdrawn from surface or groundwater sources, such as rivers, lakes, streams, or aquifers. This includes water that may later be returned to the same watershed.
Blue Water Consumption, or BWC, measures the portion of withdrawn freshwater that is not returned to the same watershed. For cotton production, this is often the more relevant volume-based measure for understanding irrigation water that is actually consumed.
A water footprint is a broader accounting concept. Depending on the method used, it may include blue water, green water from rainfall stored in the soil and used by the crop, and grey water, which estimates the water needed to dilute pollutants to meet water-quality standards. This LCA does not calculate a full water footprint, so its water results should not be described as a “water footprint.”
AWARE, or Available Water Remaining, is an impact assessment method rather than a simple water volume. AWARE considers regional water scarcity by evaluating how much water remains available in a watershed after human and ecosystem needs are considered. This means the same amount of water consumption can have a different potential impact depending on where it occurs.
In simple terms: blue water use is water withdrawn, blue water consumption is water not returned, water footprint is a broader accounting concept not calculated in this LCA, and AWARE evaluates potential water scarcity impact based on local conditions.
Yes. This LCA was conducted in conformance with ISO 14040 and ISO 14044 and is highly aligned with the Cascale Cotton LCA Methodology used in the Higg Product Tools.
The Cascale methodology provides cotton-specific guidance on system boundaries, data collection requirements, allocation procedures, secondary datasets, and interpretation of life cycle impact assessment results. It was developed to improve consistency in cotton fiber LCA data used through the Higg Product Tools.
Cotton Incorporated participated in the expert group that helped develop this methodology. Aligning with this method helps make the results more consistent, transparent, and usable for brands, retailers, and sustainability professionals evaluating cotton fiber impacts.
However, alignment with an accepted industry methodology does not mean cotton LCAs should be directly compared. The methodology specifically cautions that comparisons can be misleading when studies differ in geography, crop year, data collection approach, background datasets, system boundaries, allocation methods, impact assessment methods, or intended use.
This LCA is best used to understand the cradle-to-gate impact profile of U.S. cotton fiber production, identify environmental hotspots, support Scope 3 Category 1 reporting where appropriate, and inform how methodological choices influence results.
Like any life cycle assessment, the results should be interpreted in context. The study relies in part on grower-reported data and modeled estimates for certain inputs, such as irrigation energy and on-farm fuel use, which introduces some uncertainty. It also focuses exclusively on environmental impacts and does not assess social or economic dimensions, so it should not be viewed as a complete sustainability evaluation.
In addition, differences in system boundaries, allocation methods, background datasets, and modeling choices across LCAs can affect results, which limits direct comparability with other studies. For more detail, see “Can this LCA’s results be compared directly to other LCAs?”
Finally, some emerging impact areas, such as plastic leakage and pollution, were not included because consistent, widely accepted methods for assessing them are still under development.
Terms to Know
Global Warming Potential (GWP)
A measure of the climate change impact potential of greenhouse gas emissions, expressed in CO2-equivalents. CO2 and methane are common contributors.
Primary Energy Demand (PED)
The total raw energy used. For example, the energy content of the coal used to generate electricity.
Blue Water Consumption (BWC)
Freshwater removed from a lake, stream, or aquifer and not returned to the watershed it was taken from. For example, this does not include water for power generation that is returned to the river it was taken from.
Blue Water Use (BWU)
Any freshwater withdrawn from a lake, stream, or aquifer. This includes water used for power generation.
Water scarcity or Available Water Remaining (AWARE)
AWARE is a water use midpoint indicator representing the relative Available WAter REmaining per area in a watershed, after the demand of humans and aquatic ecosystems has been met.
Abiotic Depletion Potential (ADP)
A representation of the consumption of non-renewable resources leading to a decrease in their future availability.
Eutrophication Potential (EP)
A measure of nutrient pollution, mainly from nitrogen (N) and phosphorus (P), that causes excessive plant and algae growth. An example impact is algal blooms and oxygen-depleted “dead zones” in lakes and coastal waters.
Ozone Depletion Potential (ODP)
A measure of air emissions that contribute to the depletion of the stratospheric ozone layer.
Photochemical Ozone Creation Potential (POCP)
A measure of emissions that react in sunlight to form ground-level smog.
Human Health Particulate Air (HHPA)
A measure of fine airborne particle emissions, such as PM2.5 from combustion, that affect human respiratory and cardiovascular health.
Land Occupation (LO)
Amount of land used over time for production